Deploy Page
Route: /deploy/:tab — Source: ui/src/pages/DeployPage.tsx
Promote trained models to a serving endpoint, configure named endpoints, run side-by-side comparisons, watch live metrics, and manage edge devices. Five tabs in one page.
Tabs
| Tab | Route | Purpose |
|---|---|---|
| Models | /deploy/models | The model registry — every trained run with metrics, aliases, and the active flag |
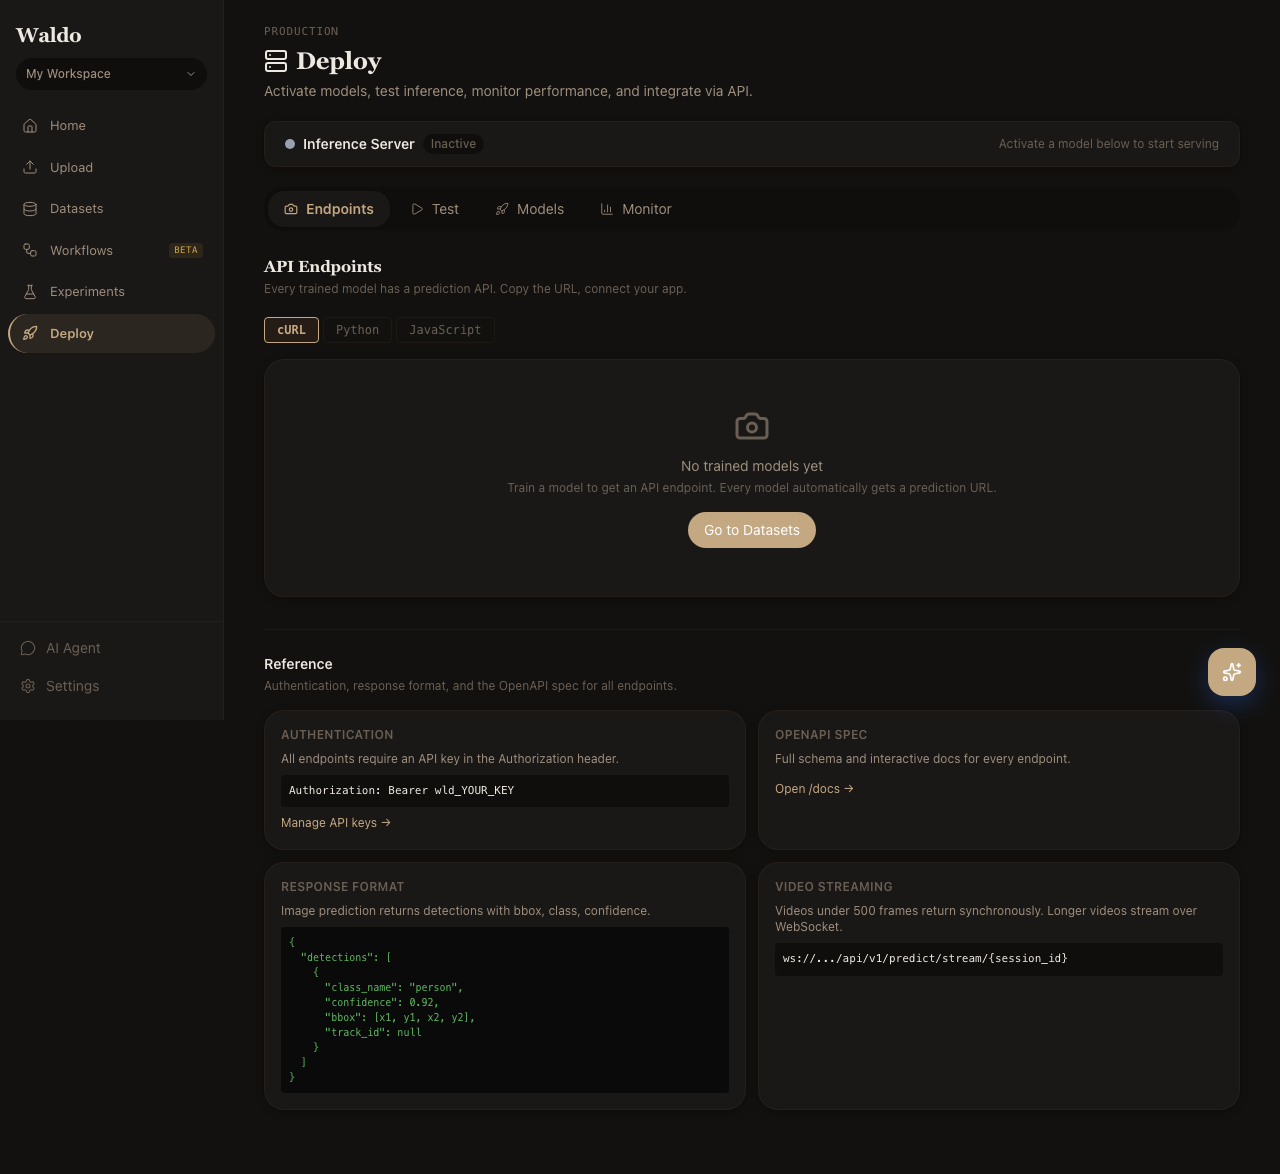
| Endpoints | /deploy/endpoints | Named serving endpoints (/endpoints/<slug>/predict) |
| Test | /deploy/test | Drag-and-drop demo: send an image to the active model and see the prediction |
| Monitor | /deploy/monitor | Live throughput, latency, and error rate per endpoint |
| Edge | /deploy/edge | Registered edge devices, last heartbeat, on-device model version |
Models
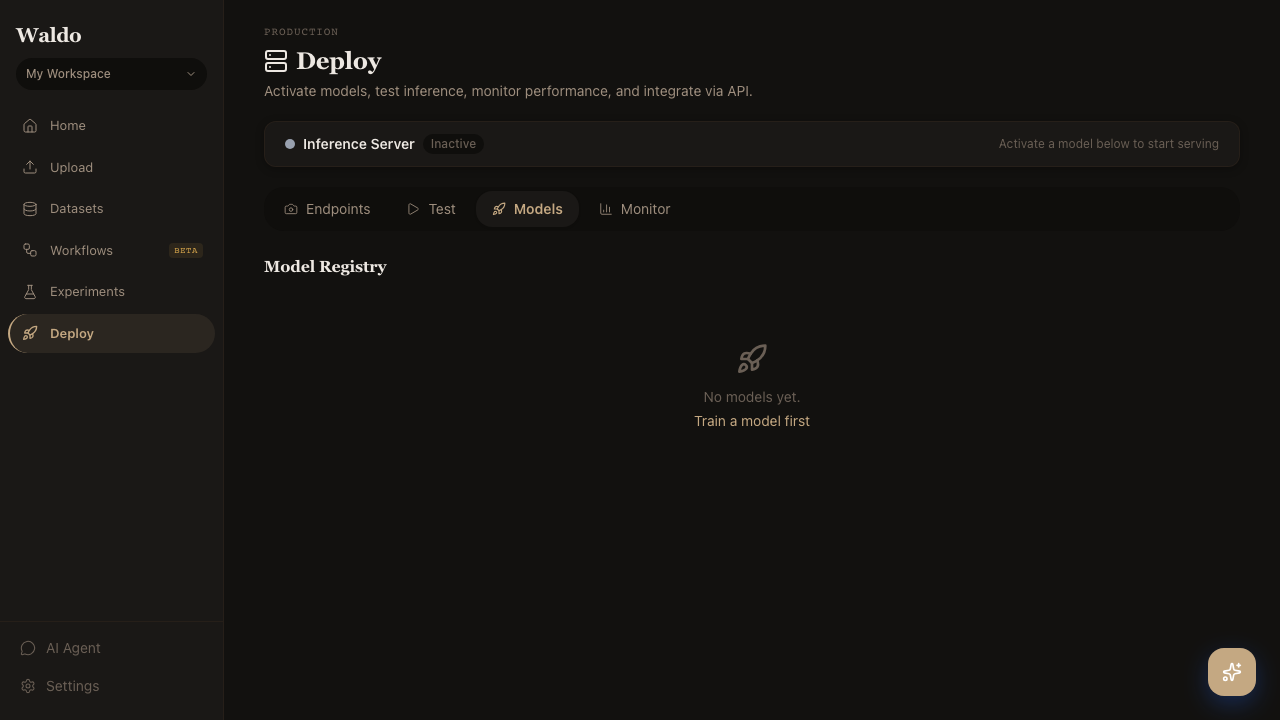
Click the star icon next to any model in the registry to mark it active. The default /predict/* endpoints will use it from the next request. Promote a model to a labeled alias (production, staging, canary) so endpoints pinned to that alias pick up the new version automatically.
Endpoints

Create endpoints with their own slug, model pin, and routing rules. Useful for:
- Blue/green deploys — run a new model on
/endpoints/staging/predictuntil you're confident, then promote. - Per-customer models —
/endpoints/customer-x/predictpinned to a custom-trained variant. - A/B testing — see Experiments.
Test
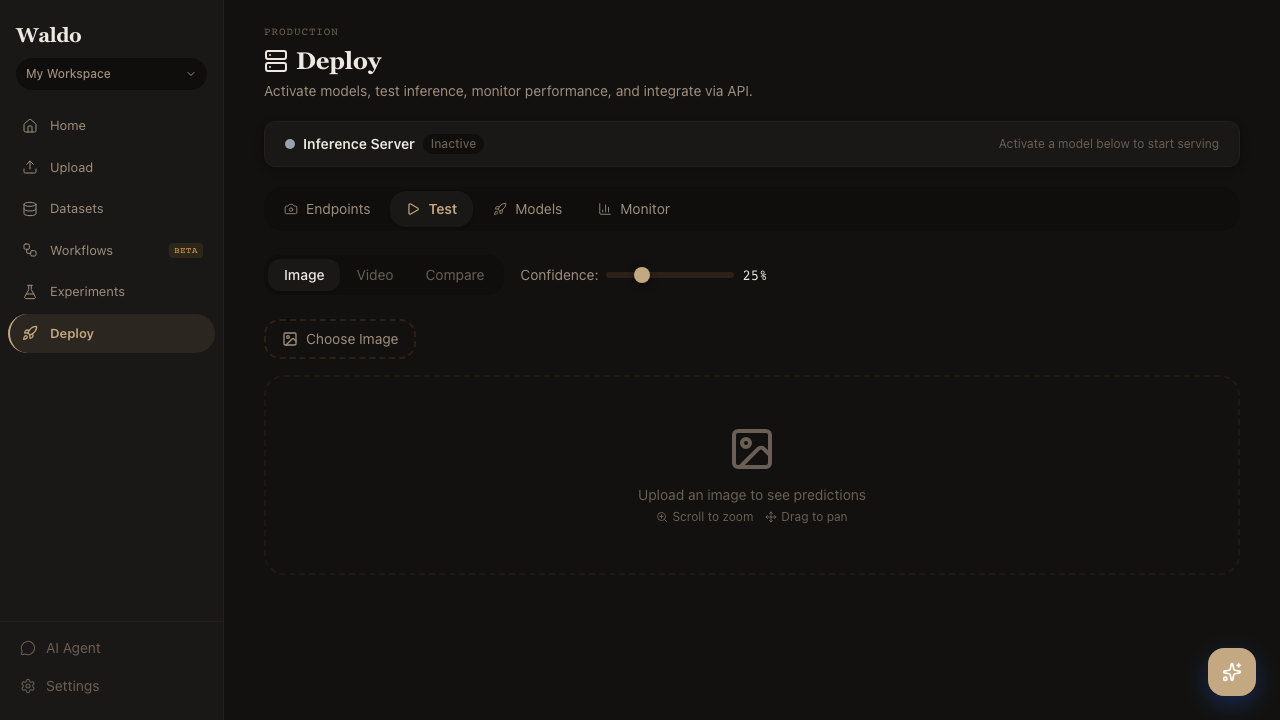
A scratchpad for sanity-checking the active model. Drop an image; the page POSTs it to /api/v1/predict/image and renders the boxes + scores side-by-side with the source.
Monitor
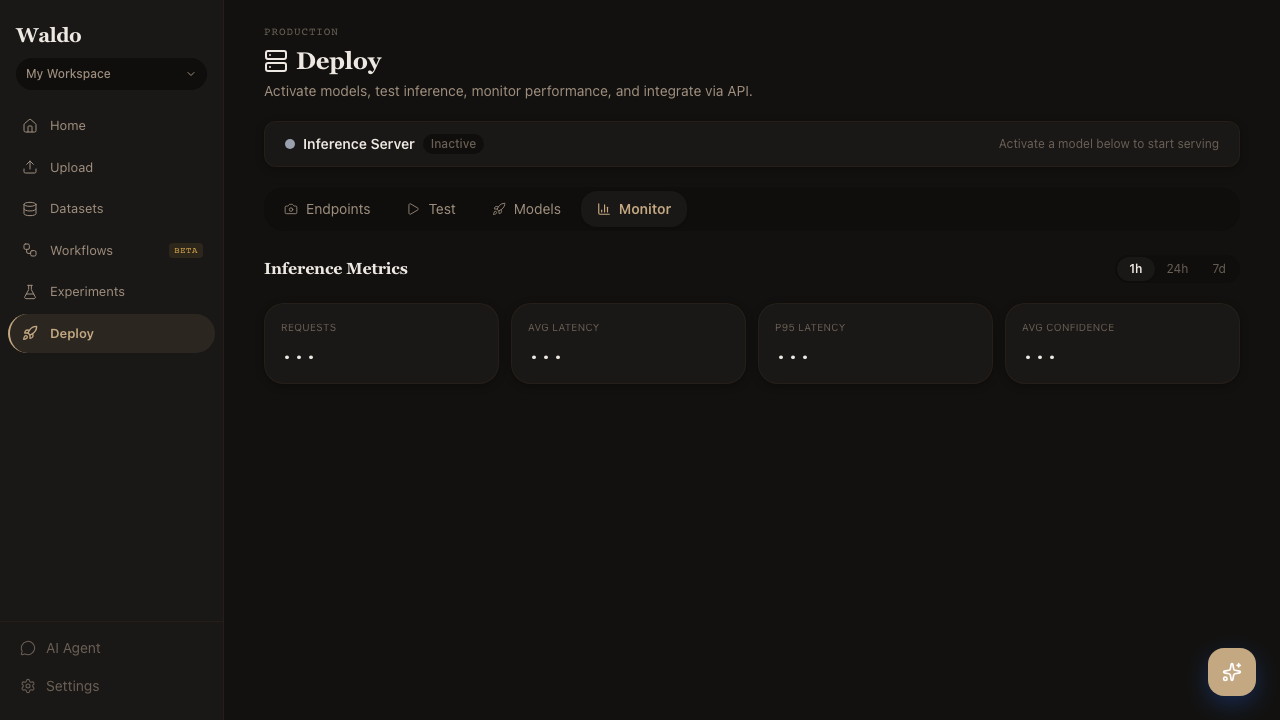
Live charts powered by GET /api/v1/metrics/summary:
- Requests per second per endpoint
- p50 / p95 / p99 latency
- Error rate (HTTP 5xx + inference exceptions)
- Class distribution of predictions
Edge

Registered Jetson and Pi+TPU devices. Each row shows last heartbeat, battery / temperature, on-device model version, and recent inference rate. Promoting a new model triggers an OTA download on the next heartbeat — see Edge deployment.